
Anesthesia practices are uniquely positioned to lead this conversation. They capture richer, case-level data than the facility, offering valuable insights into surgeon behavior, case flow and the financial performance of anesthesia services. When leveraged effectively, this data transforms OR utilization from a passive metric into a strategic lever—one that can drive revenue optimization, inform staffing decisions and strengthen alignment with hospital leadership.
What Does “Optimal” Utilization Really Mean?
In many organizations, OR schedules are built around surgeon preference—not anesthesia capacity. Surgeons often prioritize early starts to accommodate clinic schedules, while late-day add-ons stretch the schedule unevenly. The result: peaks of intense activity followed by costly downtime.
True optimization requires stepping back and redefining productivity. While industry benchmarks often cite 80% utilization as optimal, that figure deserves closer scrutiny. Importantly, the 80% benchmark typically includes turnaround time—a factor that varies widely by facility. Without clearly defining what turnaround time is assumed in that percentage—and documenting the actual average turnaround time—the metric loses meaning.
Production vs. Productivity: Not the Same Thing
Traditional reports tell you what you produced—not how efficiently you produced it. To truly understand performance, practices must compare productive (billable) time against total staffed time. Even commonly used metrics need better context. For example: What defines a “day”? Is it eight hours, 10 hours or extended coverage? Without that clarity, comparisons between locations—or against internal benchmarks—can be misleading.
Understanding Production by Location
The chart below shows average units billed per anesthetizing location per day. This is a useful tool for evaluating and comparing production levels per location. This chart is based on an eight-hour day.
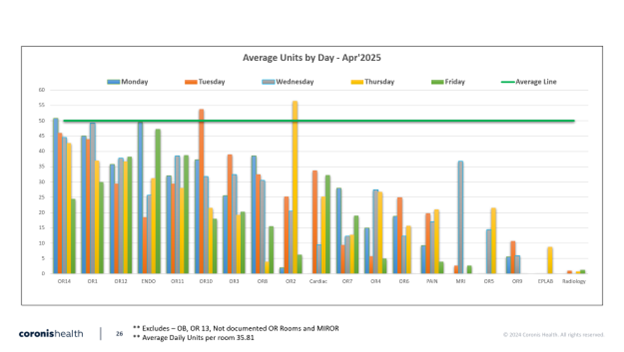
While helpful, these types of charts can unintentionally oversimplify performance—particularly when an “average” benchmark (often around 50 units per day) is used as a visual reference point.
Historically, 50 units per day may have implied a profitable site. Today, that assumption no longer holds. Let’s look at current economics:
- At 50 units/day × $50 per unit = $2,500/day
- That revenue level does not cover the cost of an anesthesiologist, given today’s compensation environment
The “new” breakeven unit threshold is often well above 50 units per day, and that threshold varies significantly based on:
- Payor mix (yield per unit—many practices are below $50/unit today)
- Care model (MD-only vs. care team)
- Staffing structure (W-2, 1099, locum)
- Coverage expectations (eight-hour vs. extended day models)
In other words, units alone don’t define profitability anymore—context does.
A Better Lens: Time-Based Utilization
The chart below provides a very different perspective, activity per anesthetizing location per hour of the day. This indicates how many providers are needed per hour of the day. This chart is particularly effective as a way of determining staffing requirements.
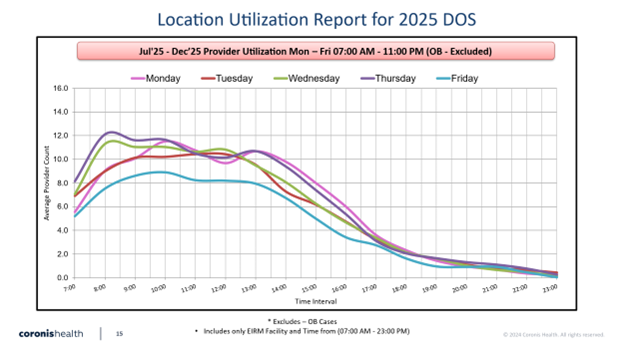
This view shifts the conversation from how much was produced to when production actually occurs. It highlights:
- Demand variability throughout the day
- Staffing mismatches (overstaffed vs. understaffed hours)
- Opportunities to reduce downtime and improve coverage alignment
This is where real operational gains are made.
From Insight to Action
When these analyses are tracked monthly, they become even more powerful. Trends emerge. Staffing changes can be measured. Schedule improvements can be validated. And, most importantly, the data becomes a compelling tool for collaboration with administration.
This is the moment where anesthesia practices can move from being reactive participants in OR scheduling to proactive drivers of efficiency and performance.
Final Thought
The Industry has evolved. Compensation has risen. Margins are tighter. And long-standing assumptions—like 50 units equating to profitability—no longer apply in many environments.
Practices that embrace a more comprehensive view of OR utilization—one that blends production, time-based demand, cost structure and payor dynamics—will be best positioned to thrive.